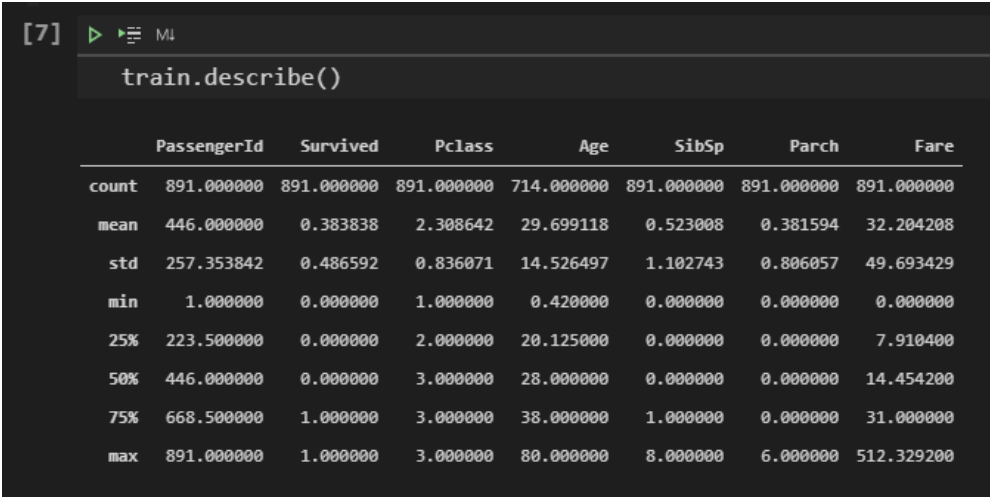
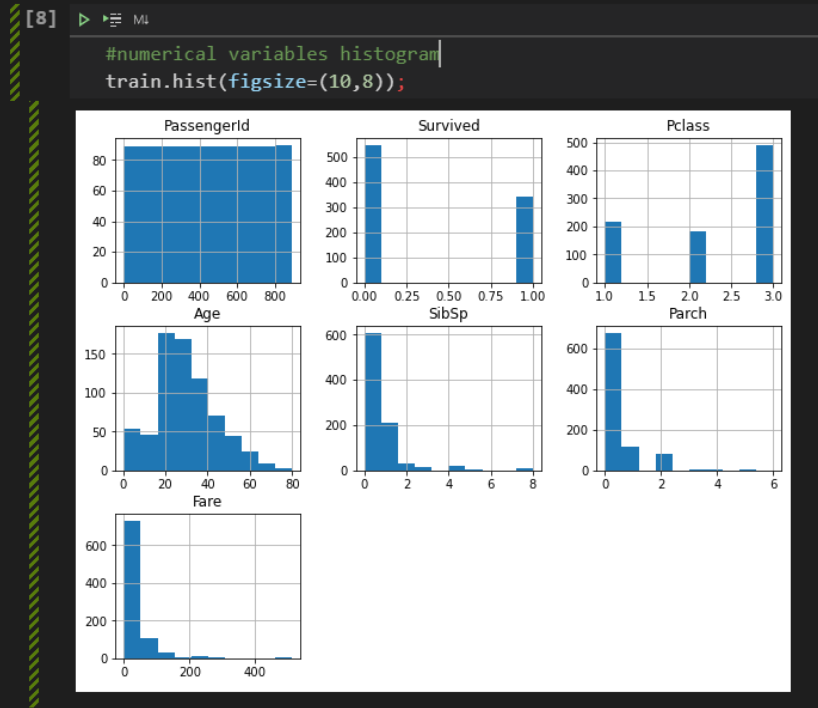
Statistical distribution of data
Using Pandas .describe() method and plotting a histogram, we will have an overview of the distribution of each variable and possible outliers and missing values. This will be useful in the next step when we will work on cleaning the data, deciding whether to delete an entry that has a missing value or fill in with the mean/median, for example.